Featured Projects

Udacity Course: Near Earth Object Detection
- Machine Learning, Python, Data Analysis, Pandas, JSON
In March 2022, I completed a nanodegree course in Intermediate Python from Udacity. One of the projects' goal was to search and explore near earth objects using data from using data from NASA/JPL's Center for Near Earth Object Studies. This project is based on the Udacity nanodegree found here.
Check it out
Udacity Course: Meme Generator
- Python, Interactive Web Interface, Numpy, Pandas, Flask
In March 2022, I completed a nanodegree course in Intermediate Python. One of the projects's goal was to create a meme generator. Given a set of images, and a list of quotes, generate a meme. See the course info at Udacity Intermediate Python".
Check it out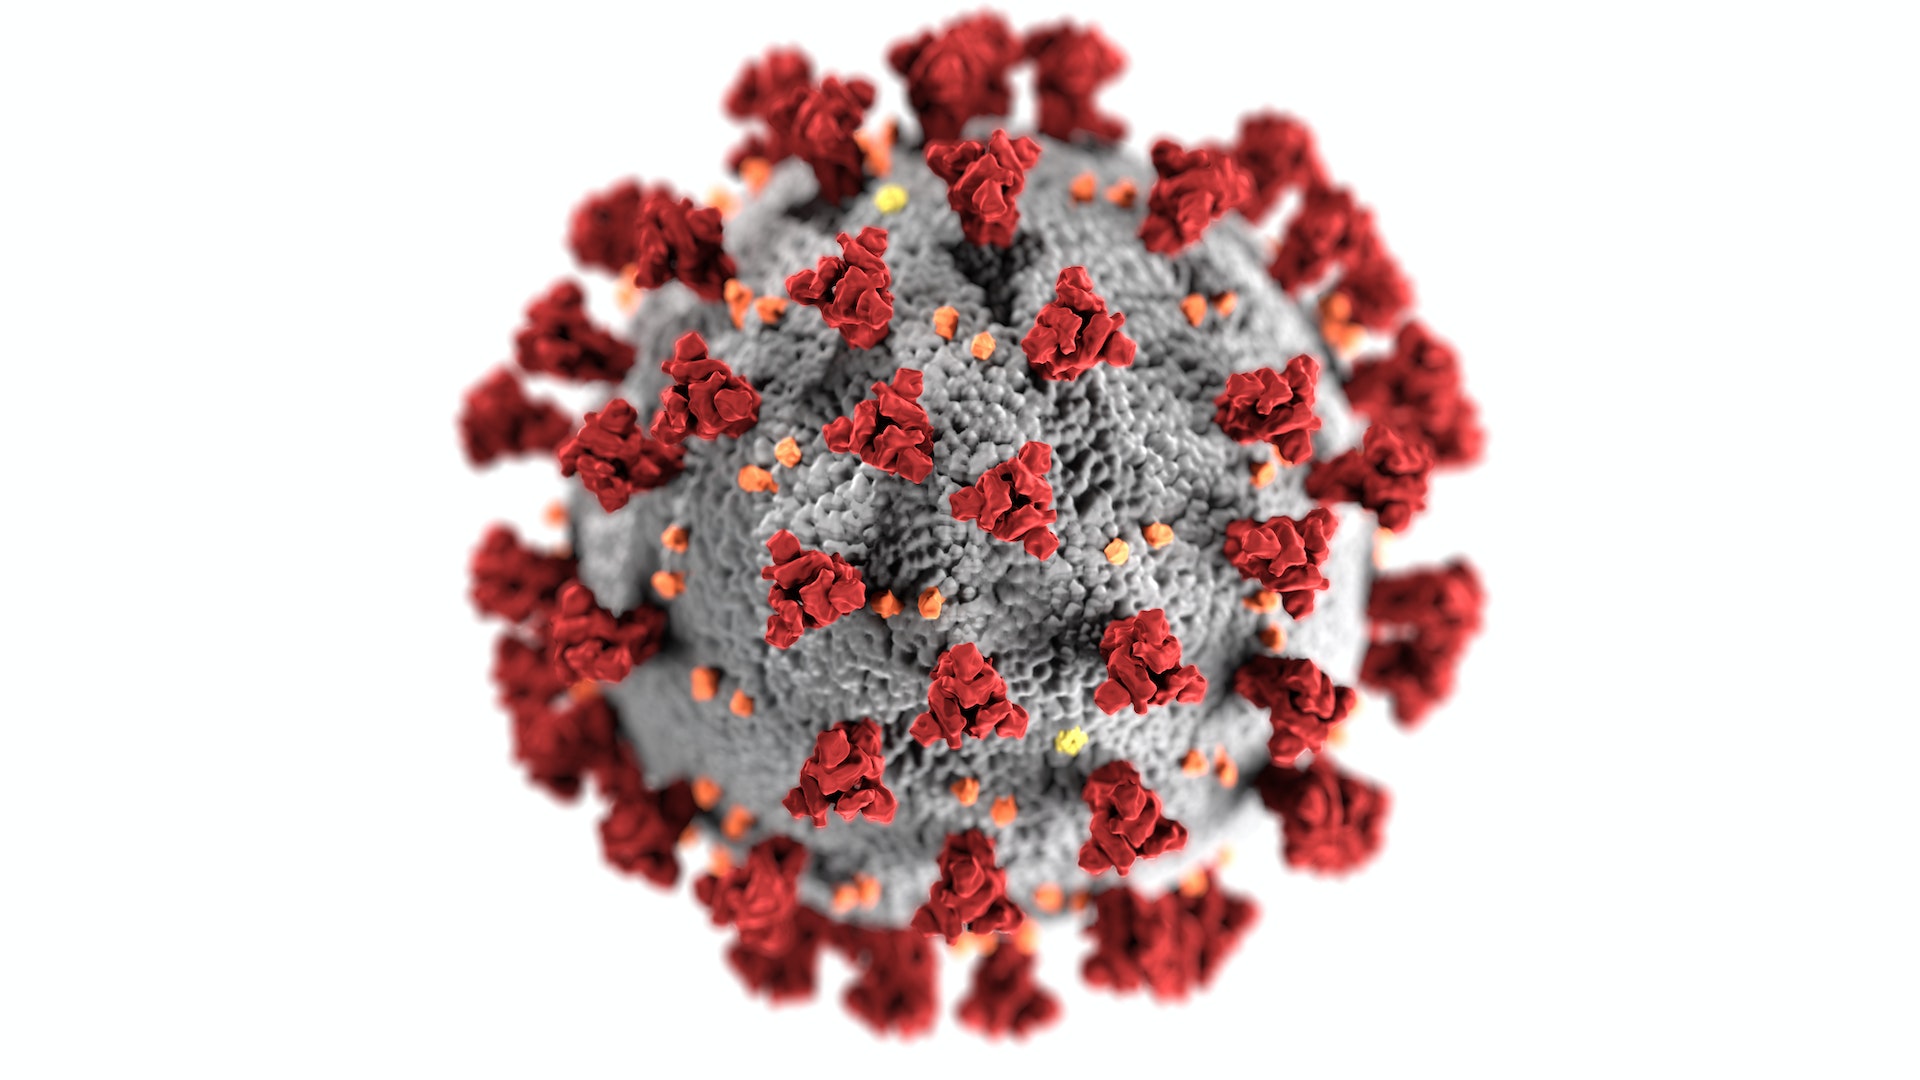
Canadian COVID-19 Data Study and Prediction
- Data Analysis, Python, Jupyter Notebook
During the month of May 2020, I had analysed the data from the COVID-19 published by the Government of Canada. The data file can be found on the website, under “Current situation”. I had used Atom to write a Python code which contained a SEIR model (Susceptibility, Exposed, Infected, Recovered). To build this model I used a Runge-Kutta method of 4th degree order in which the four dimensions were SEIR. Then, I used a linear regression model to predict the data in June by studying the data from May.
Check it out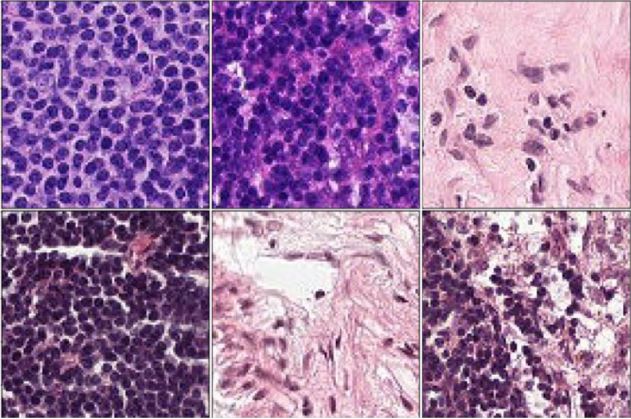
Cancer Detection Project - Image Recognition
- Machine Learning, Python, Data Analysis
In summer 2019, I have worked on a capstone project for the completion of a Data Science diploma from Brainstation. For this project I have developed my own convolutional neural network algorithm using imaging data of lymph node sections. The model was 80-87% accurate which sufficient for the given circumstances. The data was provided by the Patch Camelyon Challenge .
Check it out
Trend Analysis of Crimes in Greater Toronto Area (GTA)
- Data Analysis, R, Tableau, Python
For a summer school project, I analyzed data publicly-provided by the Toronto Police on Crime rates. Interestingly enough, the highest crime hours are at 12 am and 12 pm respectively. Regarding the areas are the most “dangerous” in GTA, please refer to the Jupyter Notebook below.
Check it out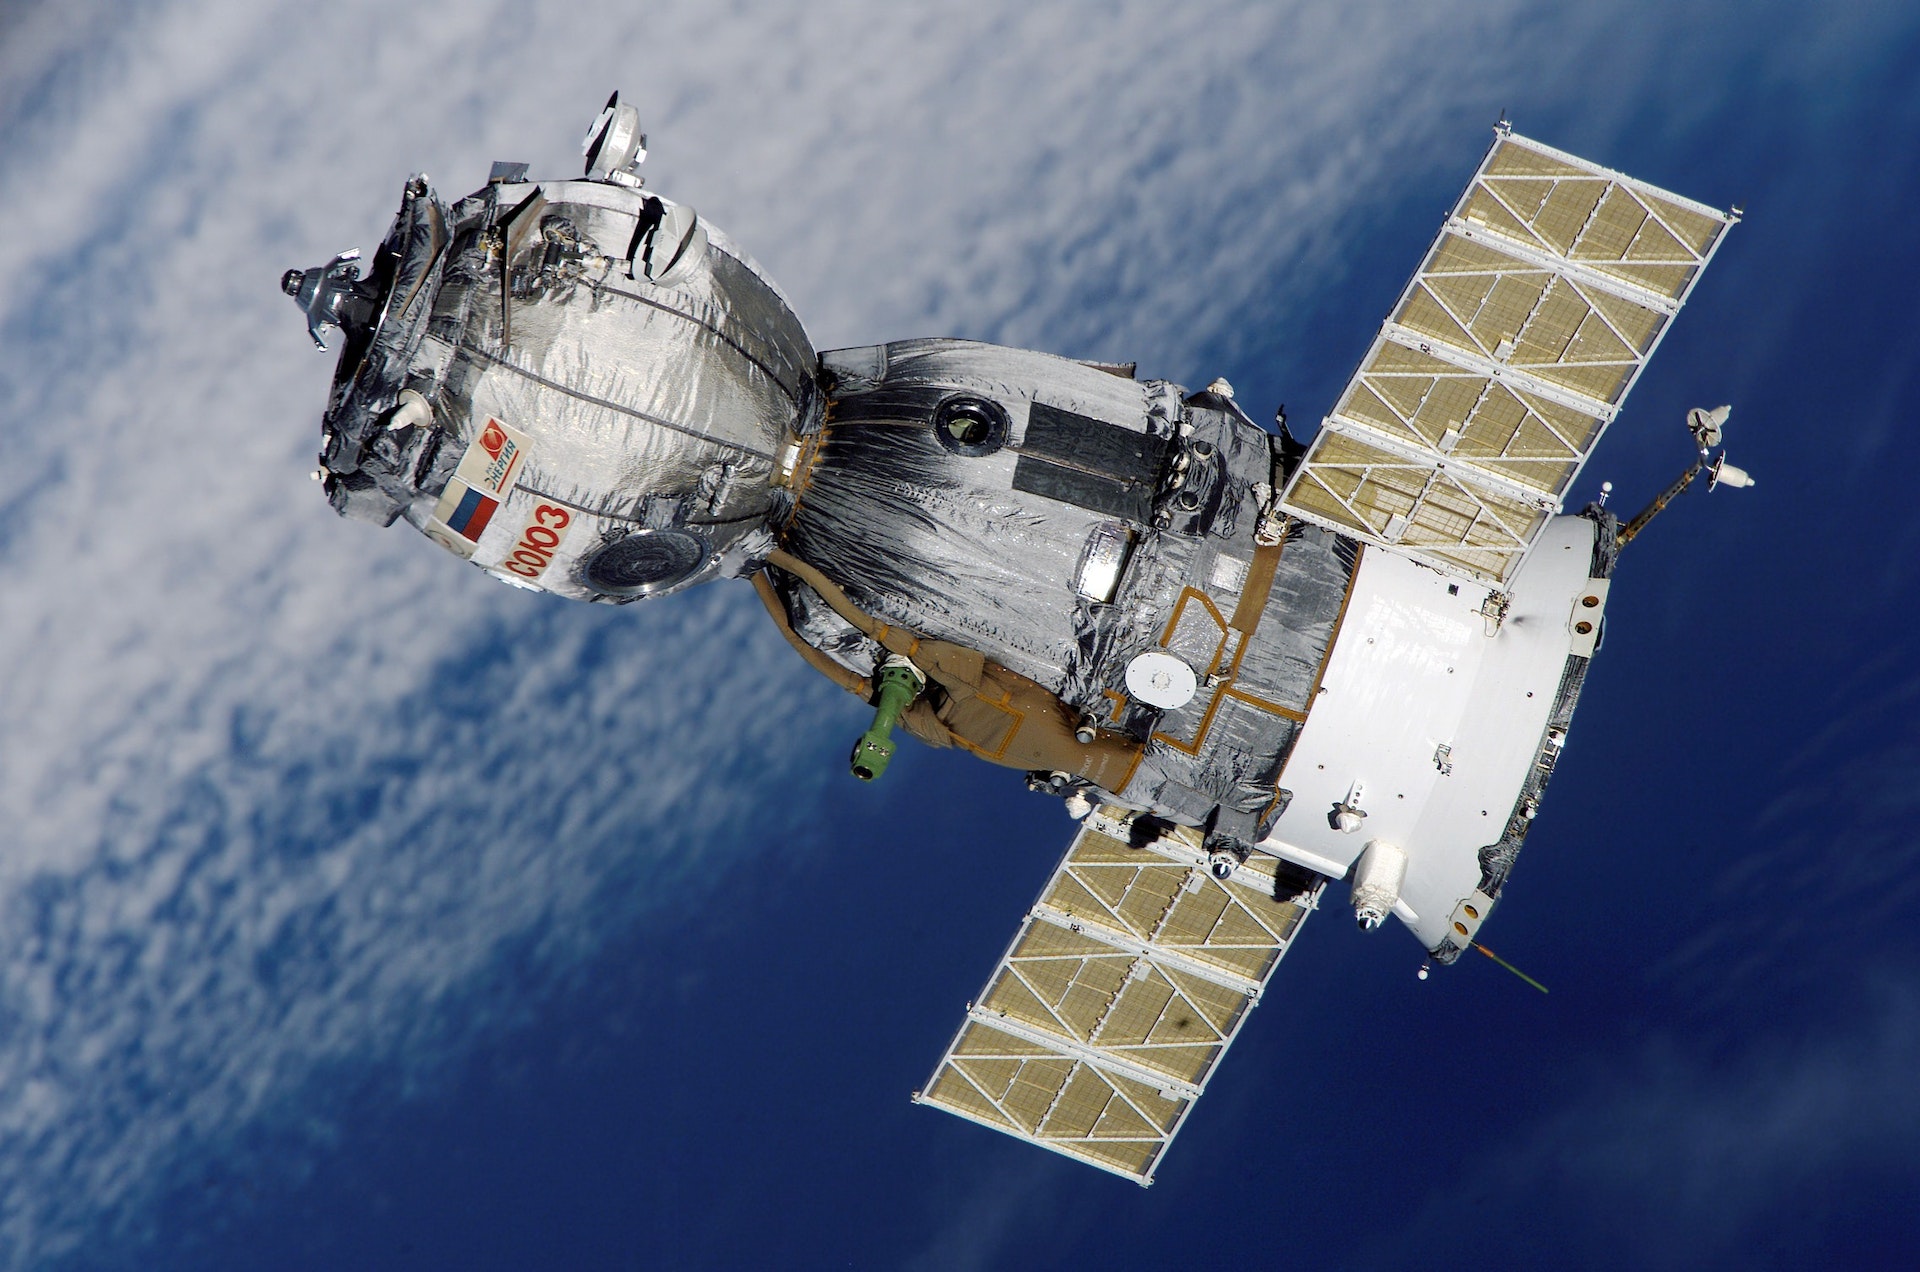
Canadian Space App Challenge
- Data Analysis, Data Cleaning, Excel, Python
In November 2019 I participated in a hackathon organized by the Canadian Space Agency (CSA) and National Aeronautics and Space Administration (NASA). My team won the challenge for our project on the analysis of neutron radiation. We compared the data collected from the International Space Station (ISS) and from schools across Canada. A lot of data had missing values, or incorrectly collected answers. Instead, we replaced the missing values with predicted approximated data containing median of schools around the area.
Check it out